Music smashes box office records: Global Value of Music Copyright soars to $45.5bn, now worth more than cinema

Image: Adobe Stock/xartproduction
11-MINUTE READ
Purpose
Whether you're investing, operating or earning from music copyright, you ought to know how much it's all worth — and how each piece of the puzzle is trending.
That’s the purpose of this annual calculation, which now receives the collaborative support of the ‘big three’ international music trade bodies: (i) IFPI, (ii) CISAC, and, more recently (iii) the International Confederation of Music Publishers, who have initiated their own ambitious exercise in valuing the publishing sector and will report later this year. In addition, the National Music Publishers Association, Music & Copyright, and MIDiA have all made valuable contributions to completing this year’s puzzle.[1]
Why bother with this exercise, particularly when we already have the IFPI Global Music Report? Copyright creates many more rights and revenue streams, such as mechanical and performing right, to name but two. This report fills in those gaps, and strips out the double‑counting, to show us where we’re at and lay the foundation for follow‑on analysis. Anyone trying to capture the attention of policymakers who don’t grasp the threat posed by AI, for example, may find it handy to have a big number showing what’s at stake. In music, this is the biggest number there is.

Image: Unsplash/Nicolas LB
The Big Number
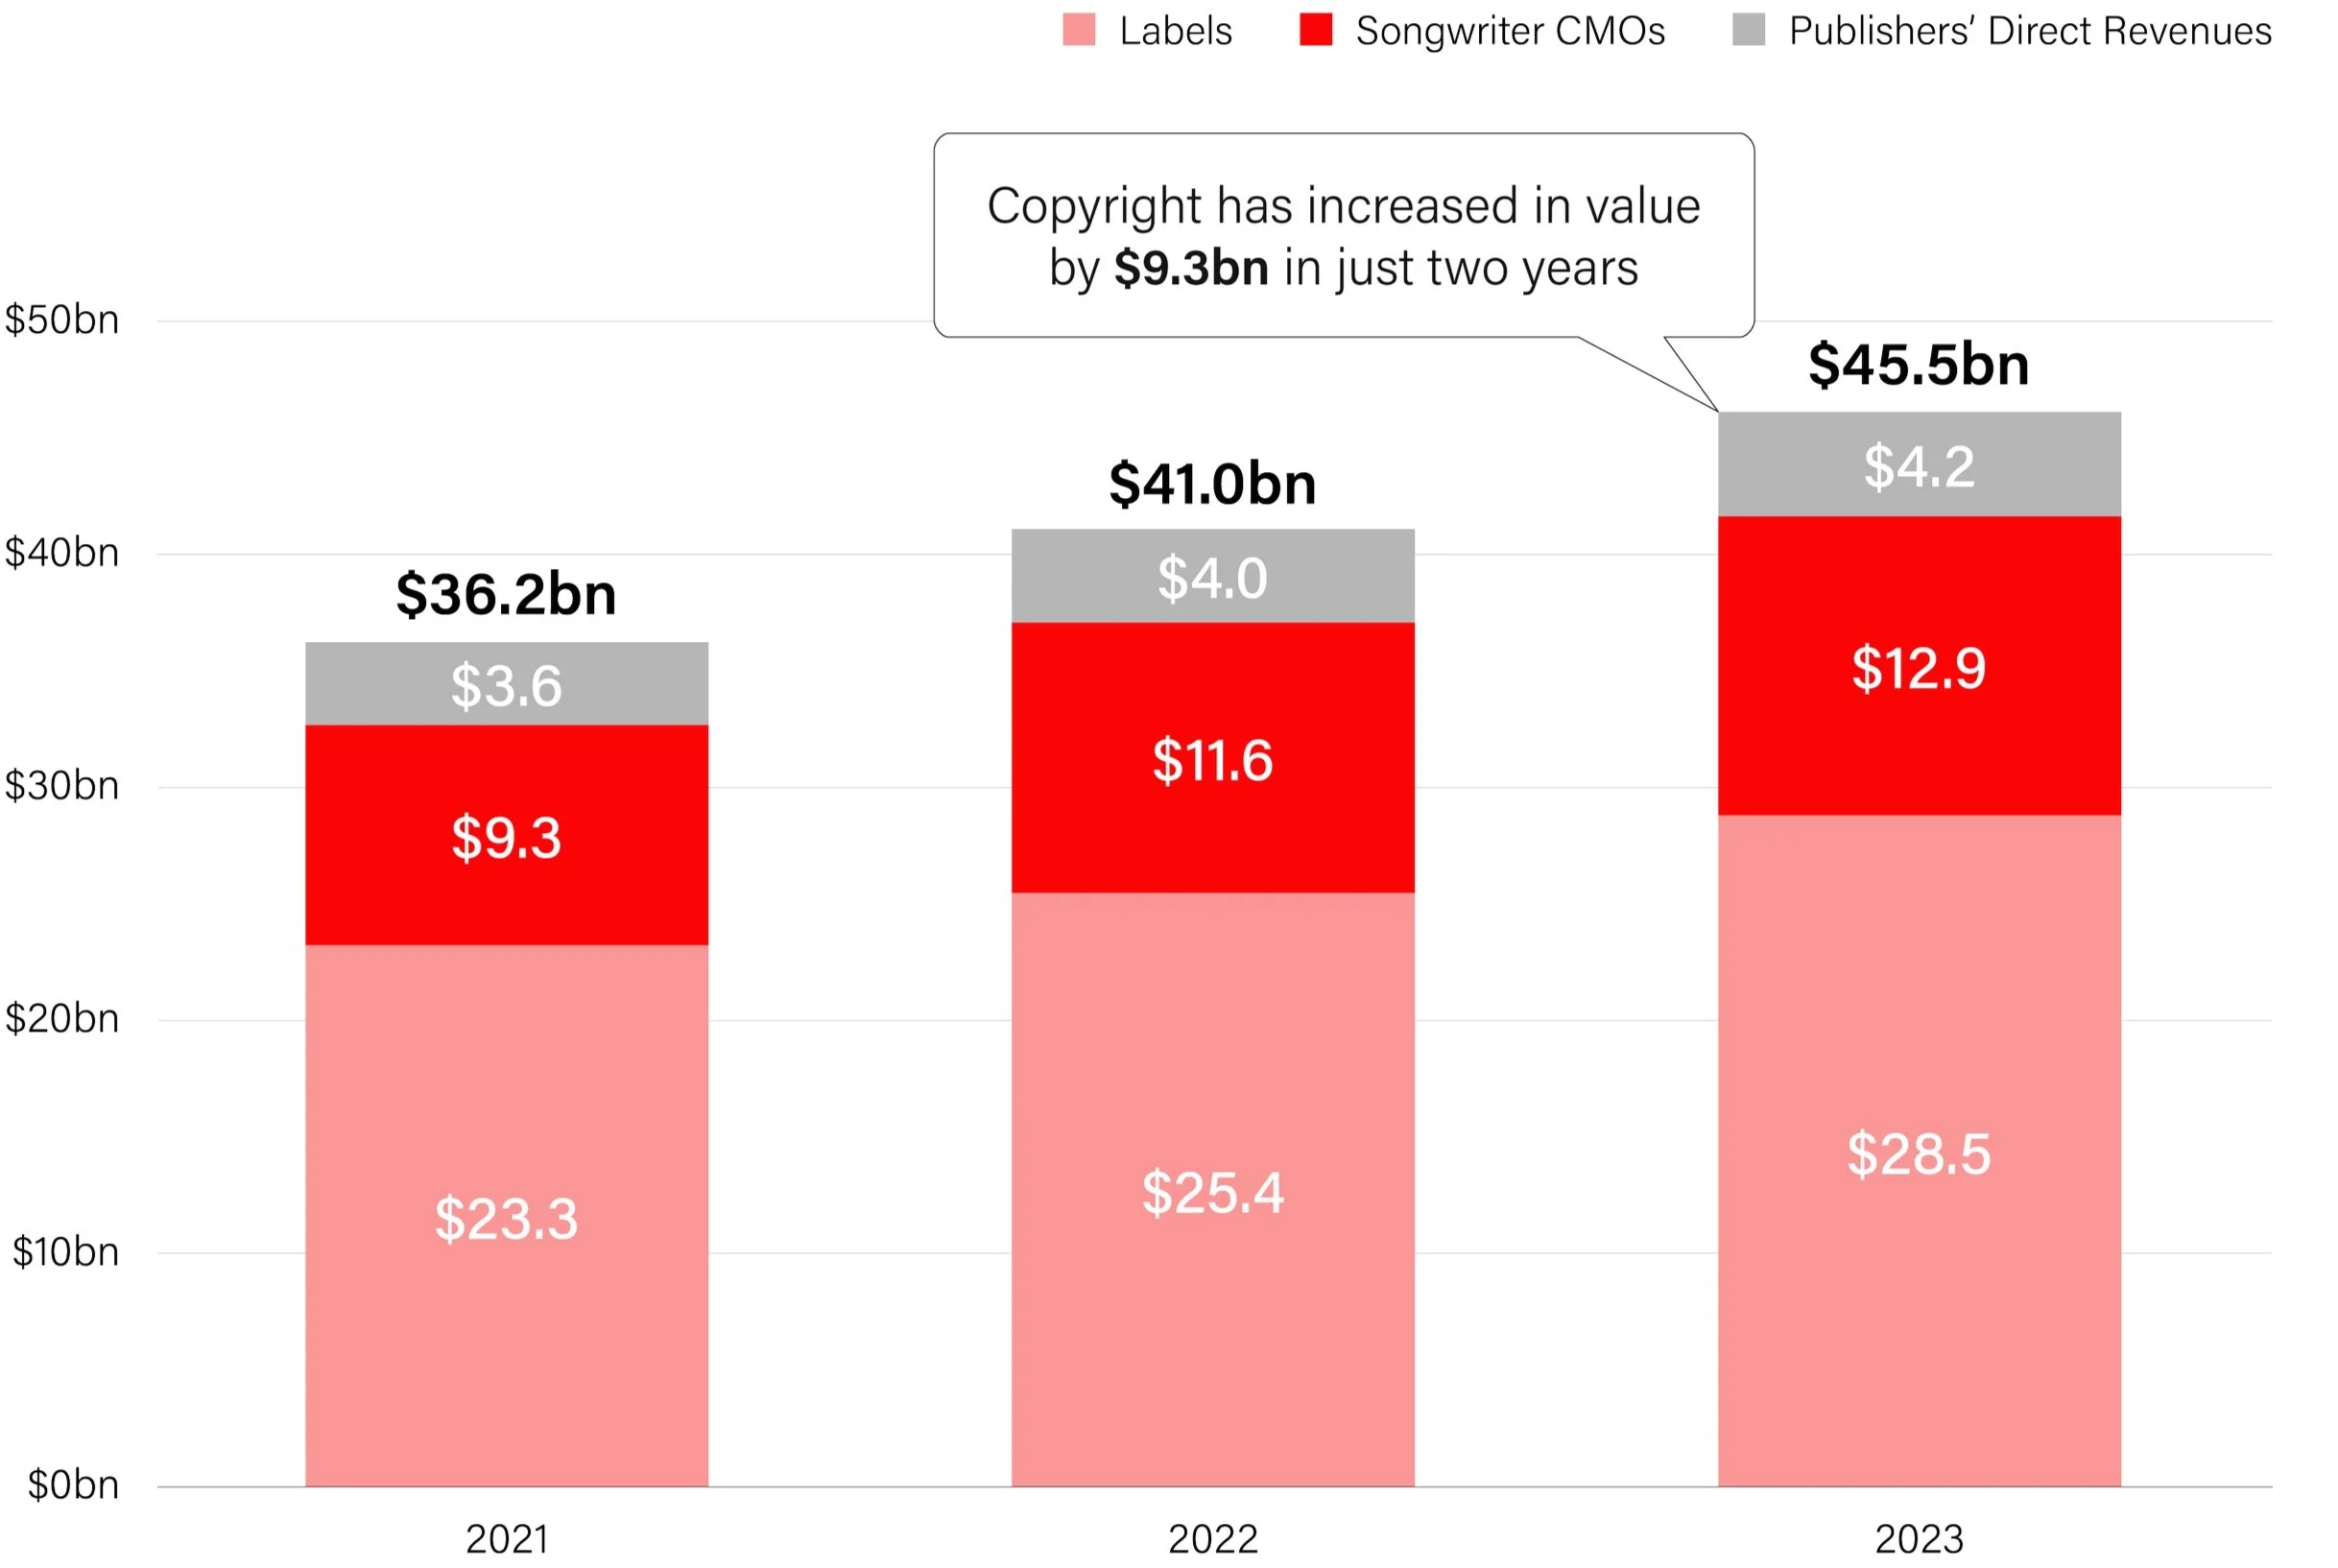
The global value of copyright in calendar year 2023 reached $45.5bn.
That's double‑digit growth (11%) year on year and a jaw‑dropping 26% up since the pandemic-riddled 2021. When I first calculated this figure nine years ago, in 2014, the figure was just $25bn.
Next year (when we calculate 2024) we may see copyright having doubled within a decade. Make no mistake: it’s boom time.
Global Value of Music Copyright
Source: IFPI Global Music Report, CISAC Global Collections Report, Music & Copyright and Will Page
Copyright’s 2023 stack is composed of $28.5bn in recorded revenues, $12.9bn in collective management organisation (CMO) collections, and $4.2bn in direct publisher income. Labels grew at the fastest annual rate (12%), followed closely by CMOs (11%), and lastly publisher direct income (4%). As the chart shows, CMOs have seen their collections bounce back from the pandemic-hit 2021 by almost 40% — but this year’s slowdown to 11% suggests collections are returning to a steady growth pattern.

Image: Unsplash/Harry Swales
Fair Division?
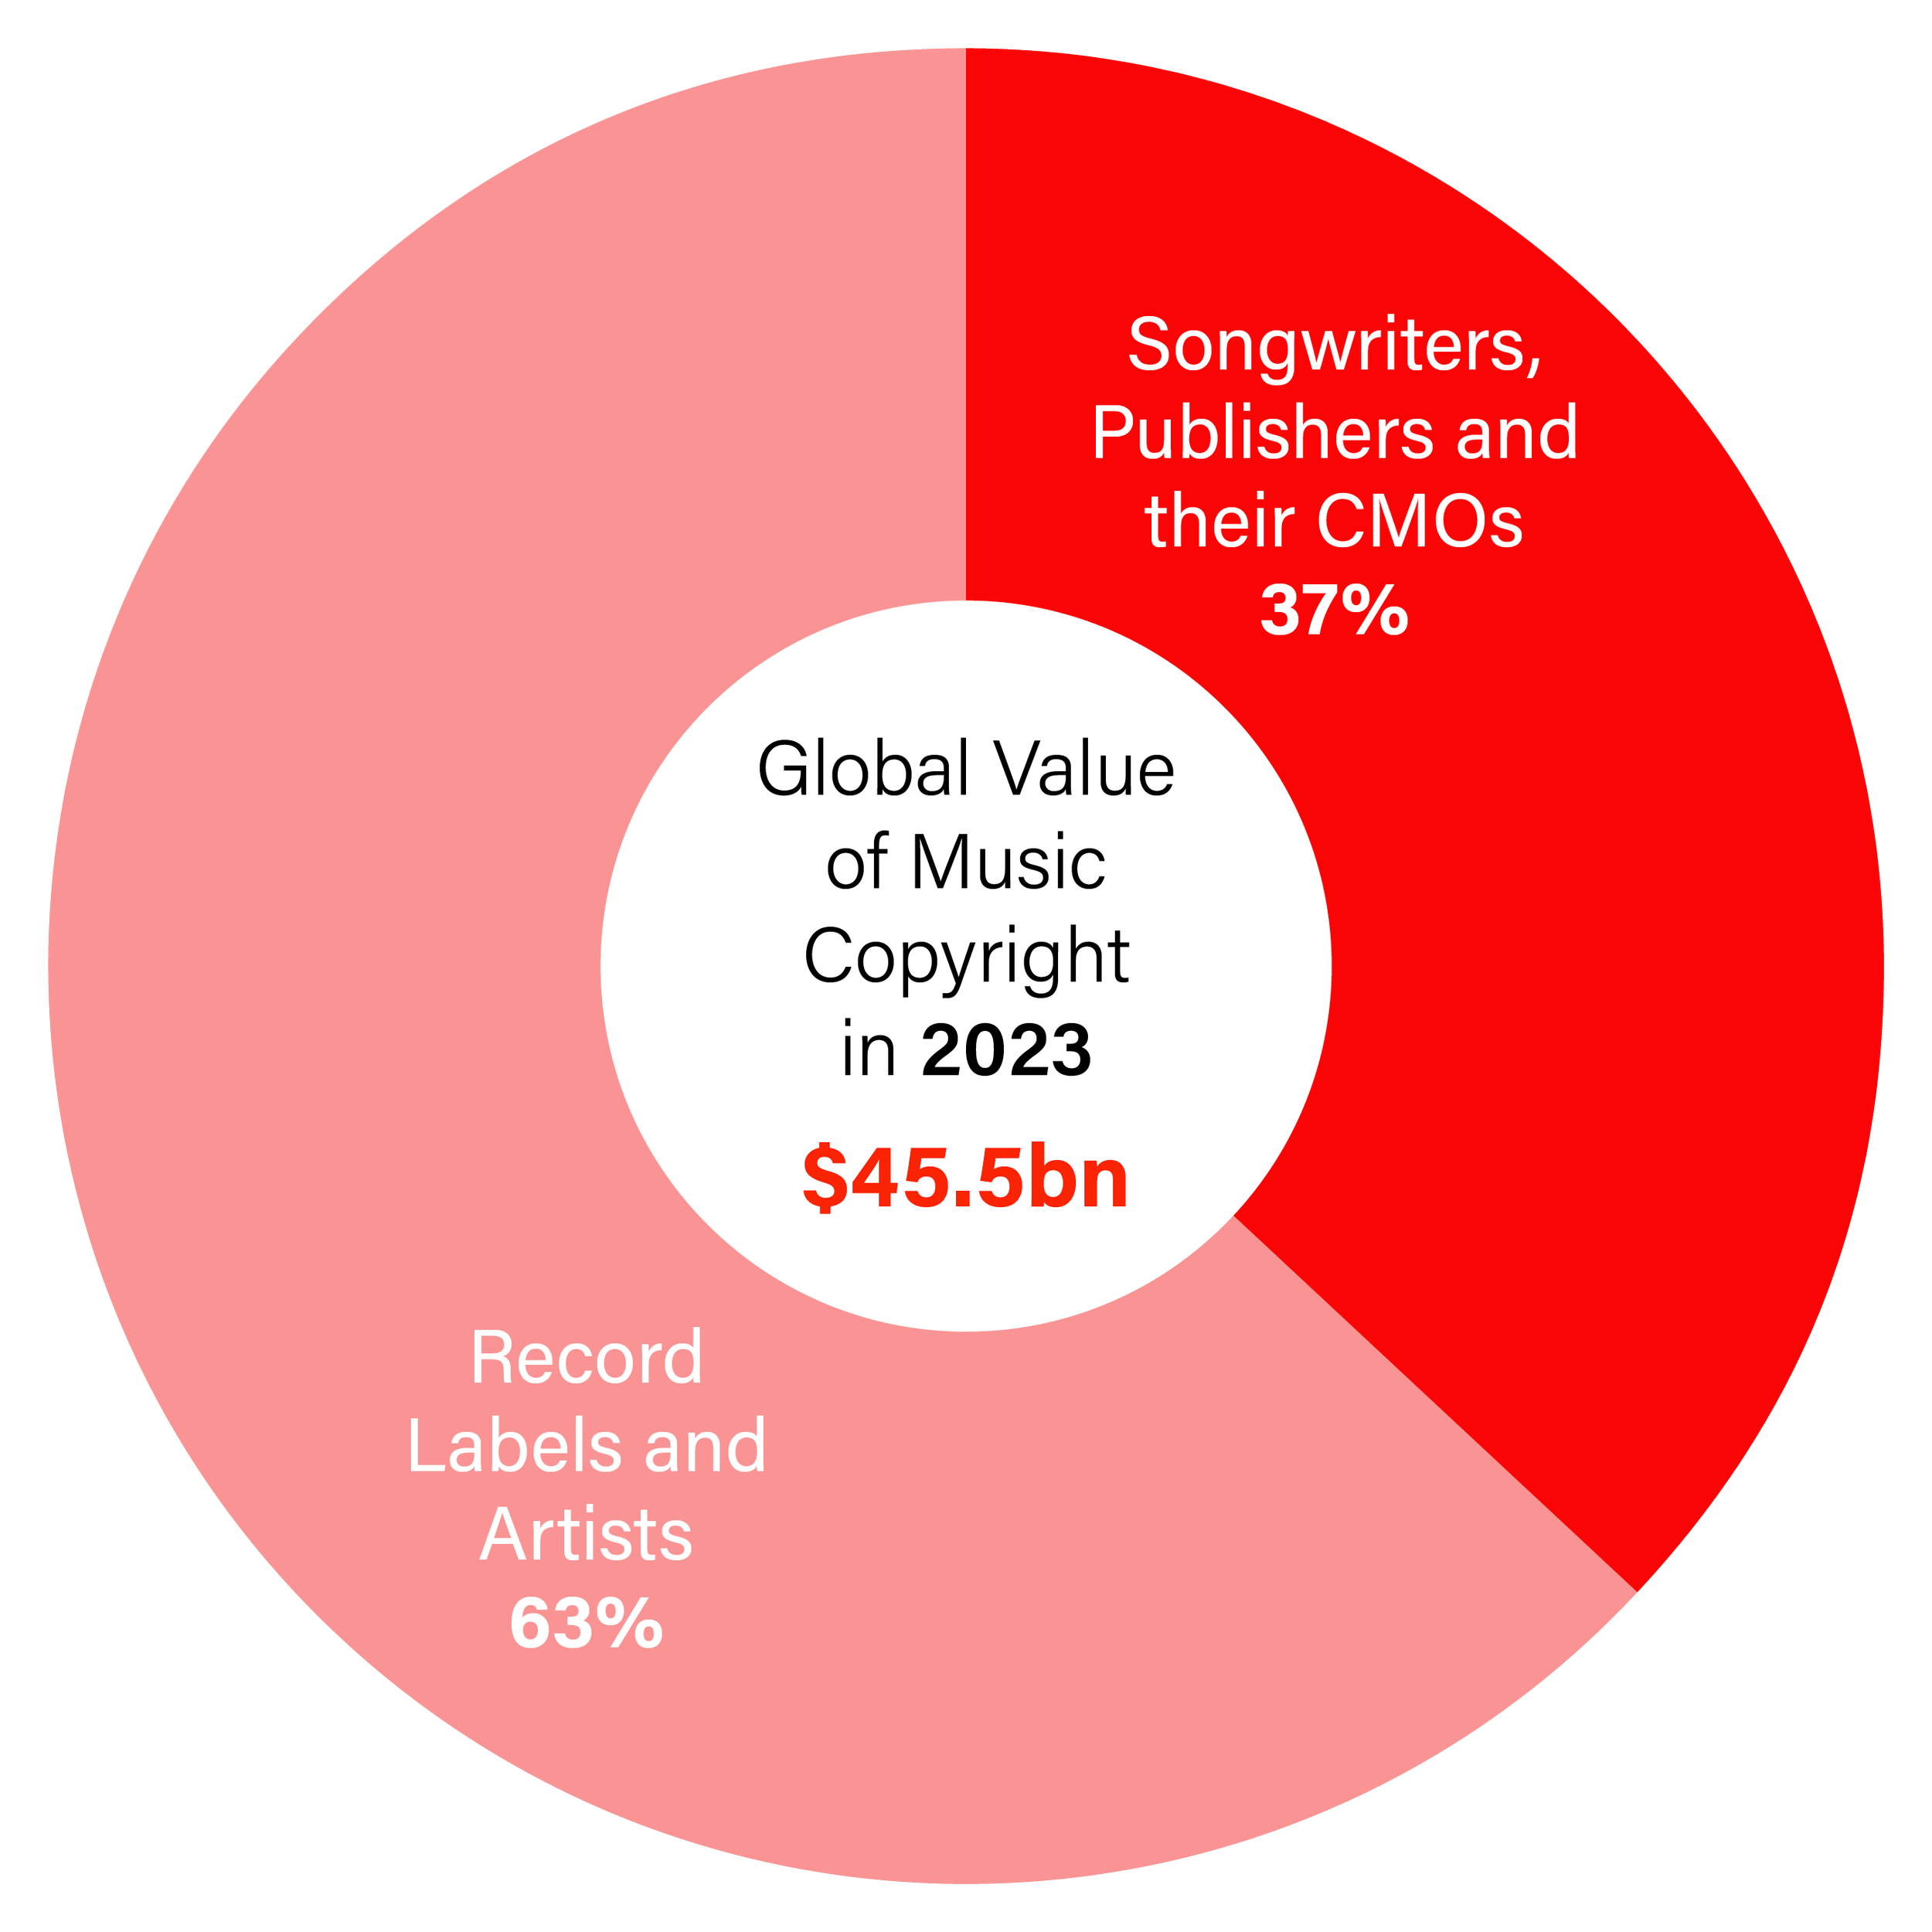
One unique property of this annual exercise is that it shows how the ($45.5bn) pie gets allocated, with 63% now going to artists and labels and 37% going to songwriters, publishers, and their CMOs. While the pie got bigger, the shares are identical to what was reported last year.
Source: IFPI Global Music Report, CISAC Global Collections Report, Music & Copyright and Will Page
Digging into the details, label income growth of 12% was driven mainly by streaming (up 10.4%), but physical is no longer a rounding error — it actually outpaced streaming growth in percentage terms (13.4%) with vinyl in particular rising by 15.4%.
There’s no sign of a slowdown either. In the US alone, vinyl will gross labels $1bn by the end of 2024.
Demand for vinyl has always been constrained by supply, but the emergence of global players, mainly based in Europe, like Record Industry (Netherlands), GZ (Czech), and Pressing Business (Poland) are helping to remove bottlenecks by increasing capacity and reducing red tape by streamlining global shipments.
Globally, vinyl will soon overtake CDs — a real sign of the format times.
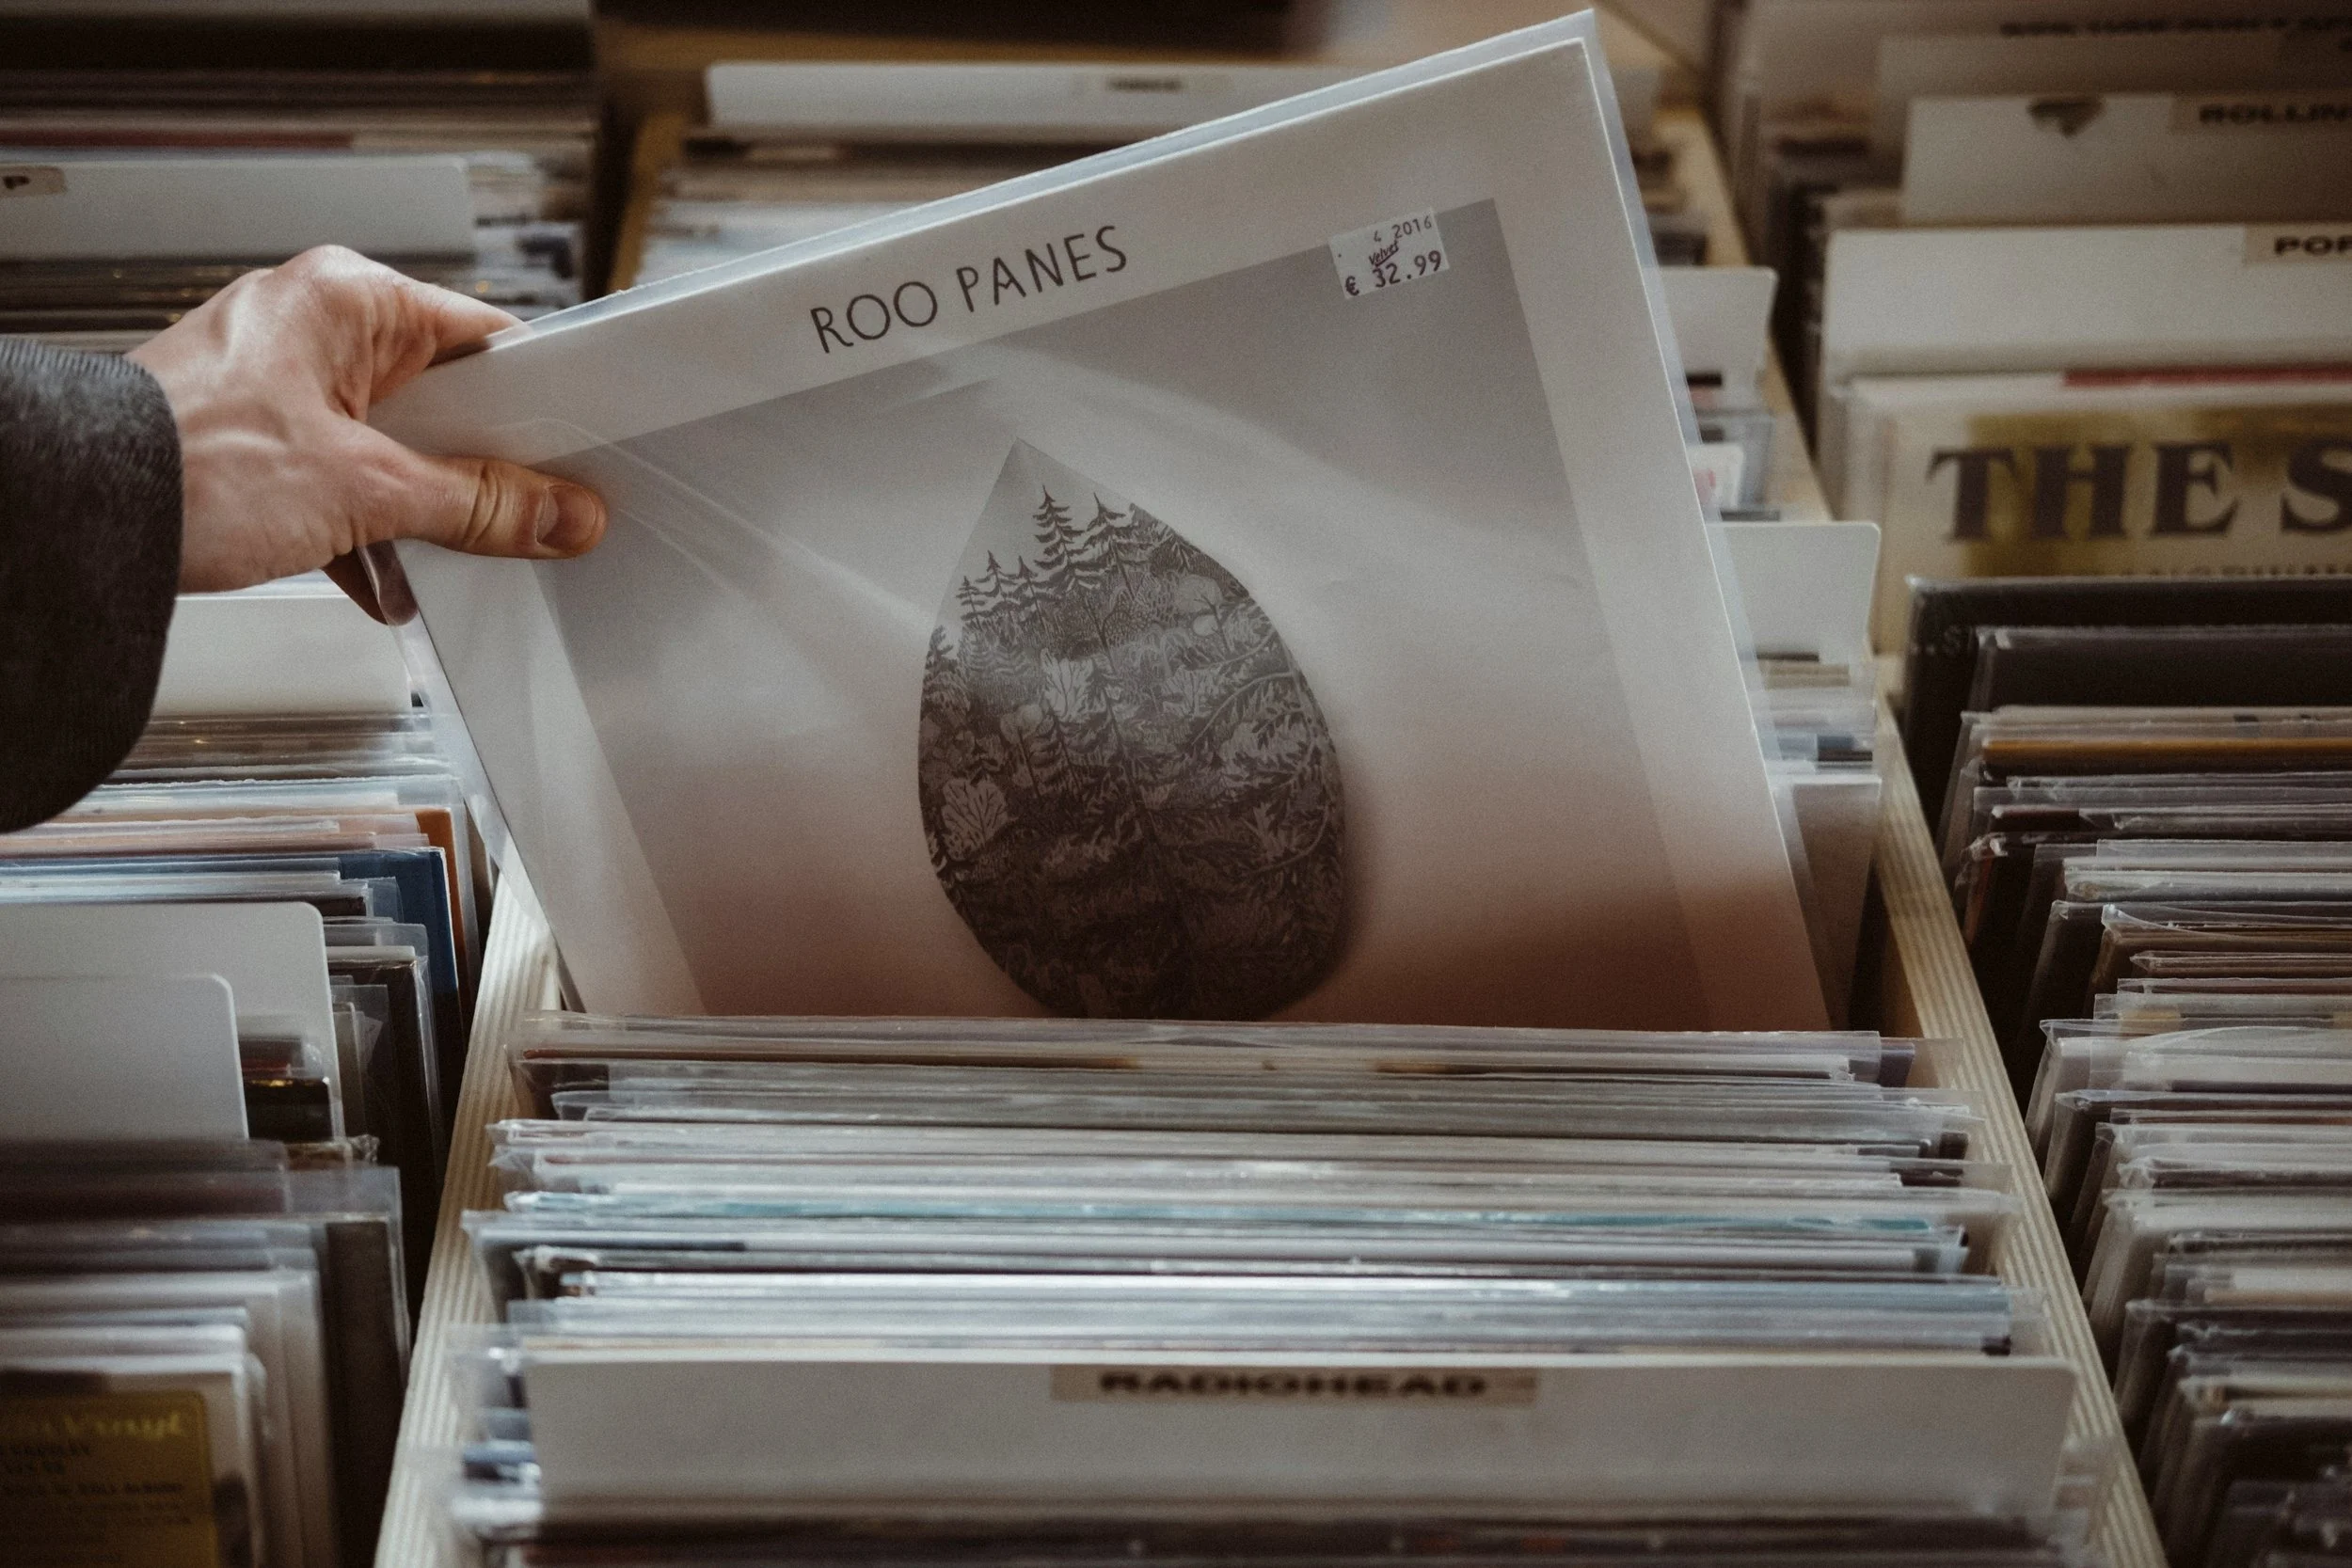
Image: Unsplash/Mitchel Lensink
Switching lanes to the CMOs and publishers, there are three structural changes that have reached a tipping point:
1.
The value to CMOs of live performance now exceeds that of general licensing for public performance. Songs sung on stage are now generating more royalties than those wallpapering the background of high streets and hotels.
2.
The value to CMOs of their digital collections exceeds that of broadcast and radio — the traditional breadwinner — and the gap is widening. For context, a decade ago, digital made up around 5% of collections, while broadcast made up half.
3.
Publishers are collecting more from the digital market through all forms of direct licensing than they receive from CMOs — lots more. Indeed, the majority of publishers' digital income circumvents the regulatory complexities of CMOs.
From an outsider looking in, one counter-intuitive point warrants closer examination. In the summer of 2024 Luminate reported 15.1% growth in the volume of global audio streams, yet Universal Music Group stock got ‘whacked’ when analysts interpreted signals to mean just 4% growth in the value of those streams. Why the divergence? The answer is the lopsided nature of that growth‑explosive volumes of free-streams in emerging regions of the South, yet a deep concentration of value of paid-streams in the established regions of the North.
North-South Divide in Value and Volume Streaming Growth
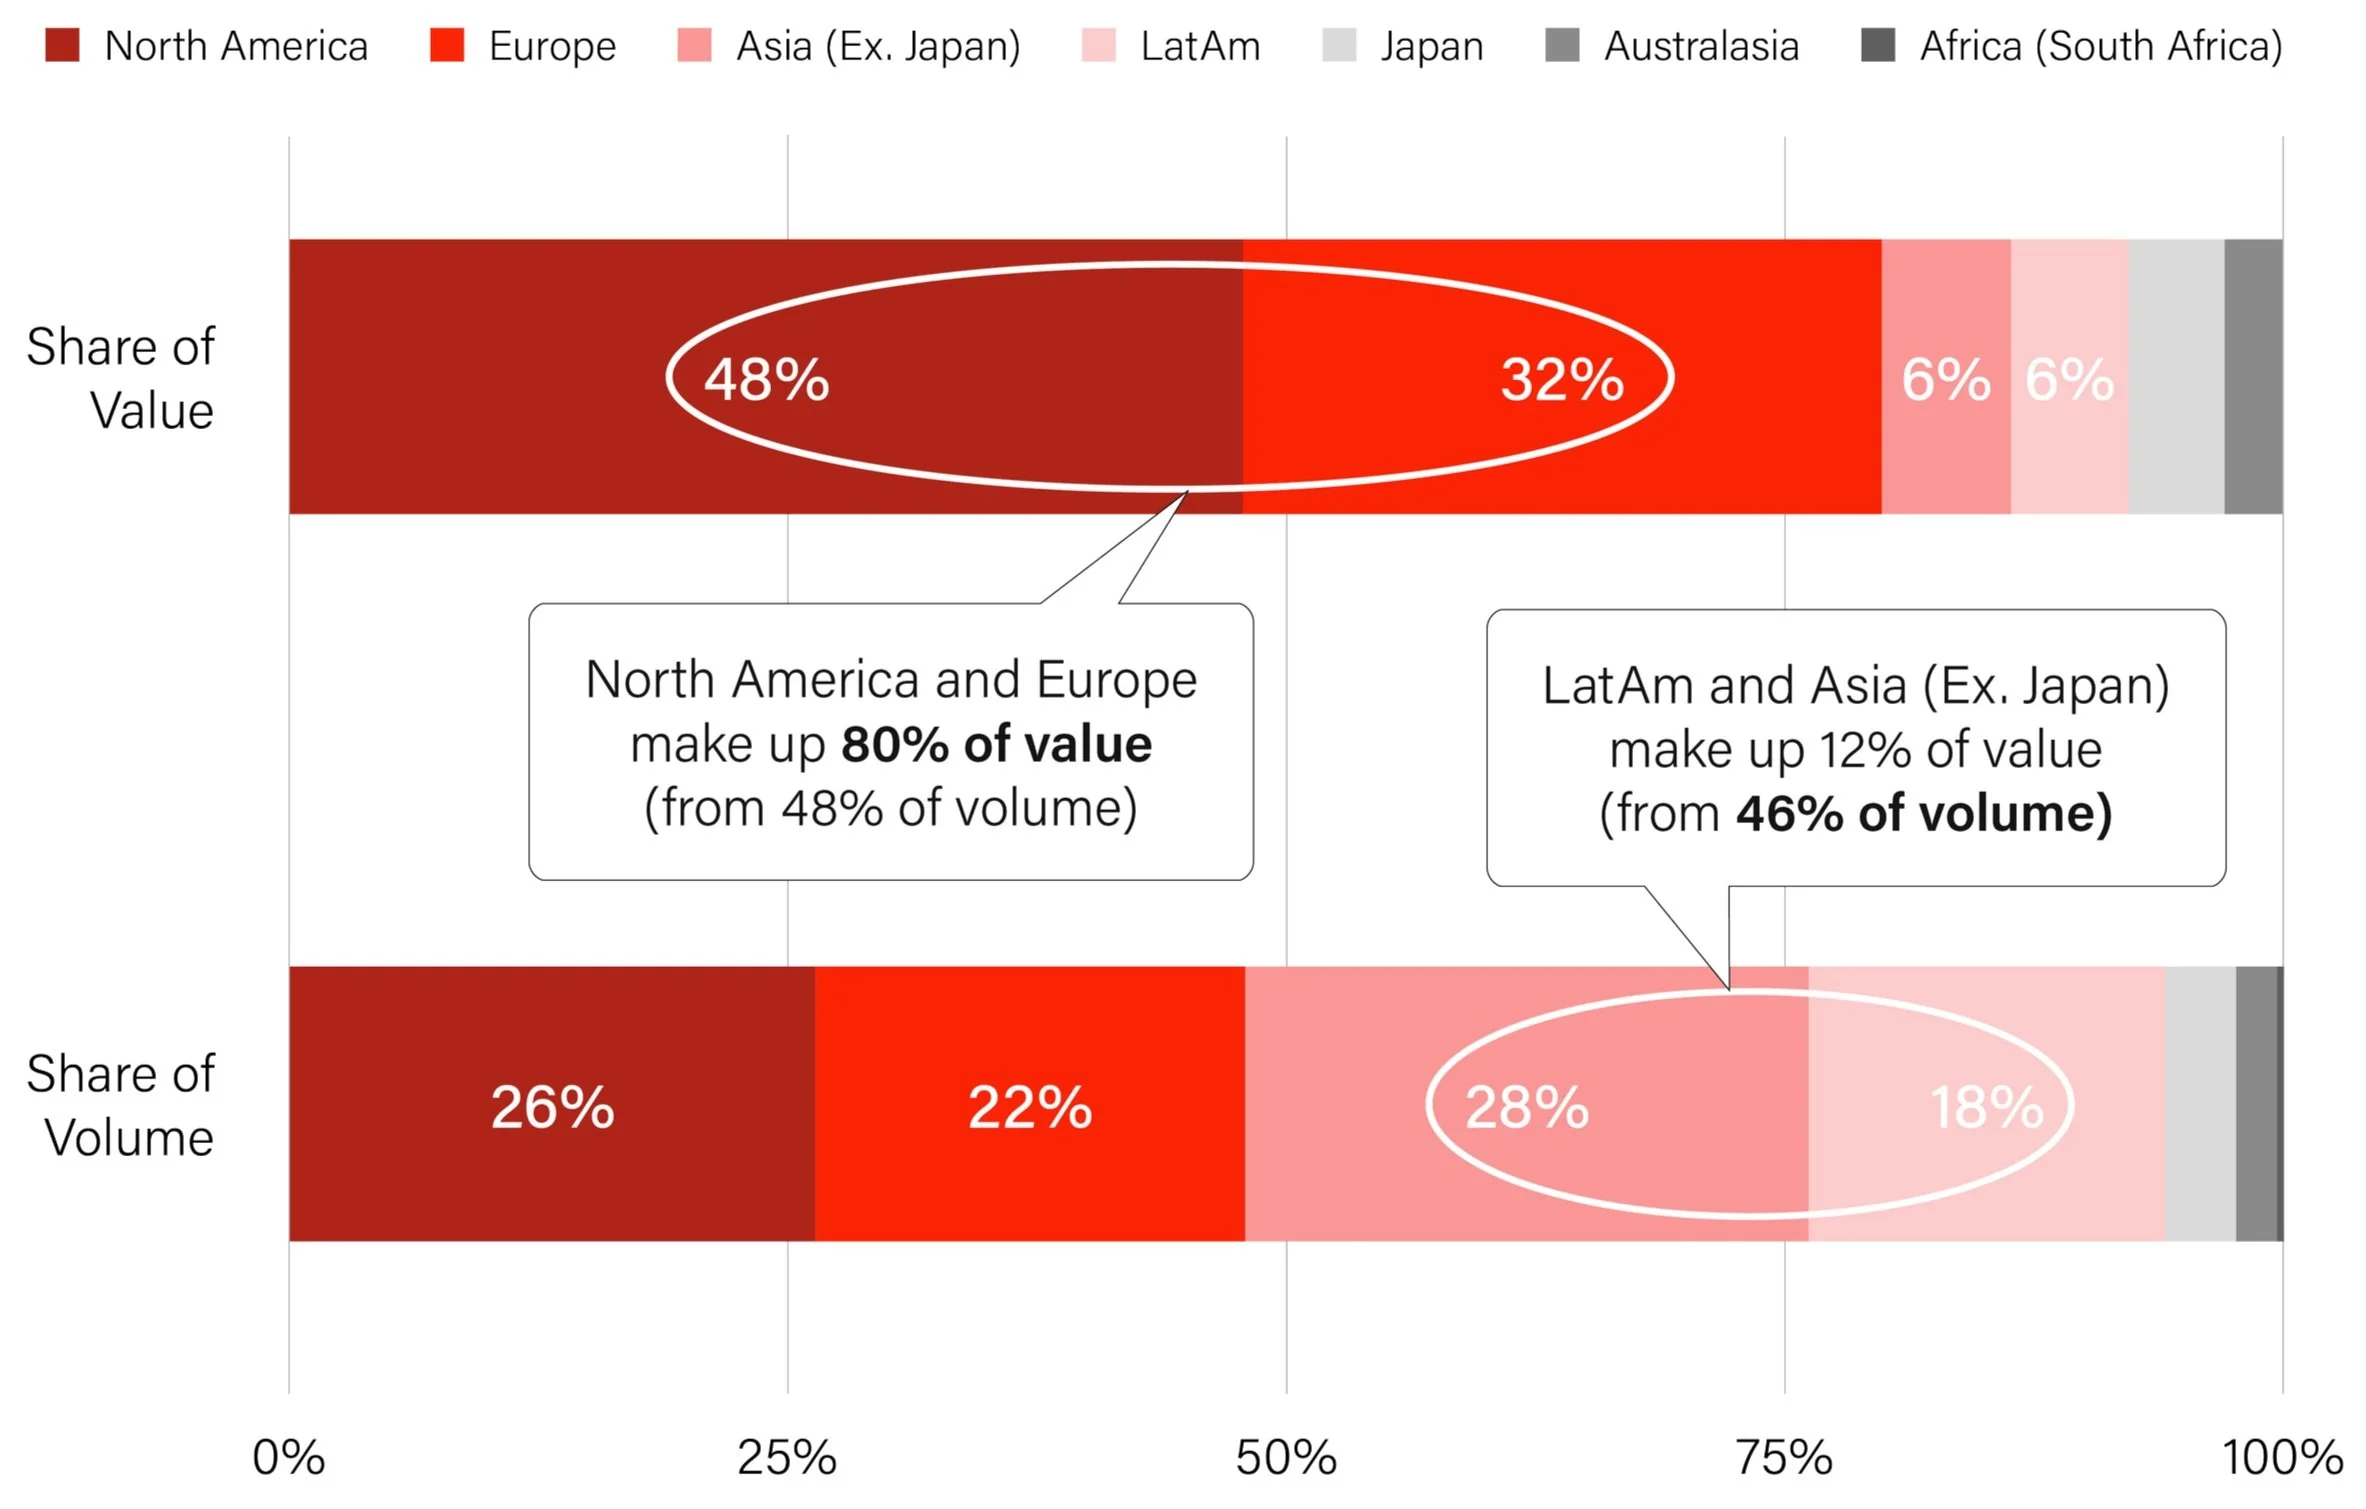

Image: Adobe Stock/Svitlana
A Changing of the Guard
If you had suggested when I first did this exercise in 2015 that music might overtake cinema, you would have been laughed out of the room. Back then, the silver screen towered over the likes of Spotify and Netflix. Ben Keen, a fellow advisor to the British Screen Forum and a three-stripe veteran of screen-time economics, summarises how the world has changed:
“The cinema market has been recovering since the COVID pandemic forced most film exhibition venues to close their doors for an unprecedented extended period. That recovery has not been as rapid as the industry would like. The 2023 total box office spend of $33.2bn, although 29% up on 2022, is still $8.7bn below the 2019 peak of $41.9bn.”[2]
Music Copyright overtakes Cinema Box Office ($bn)
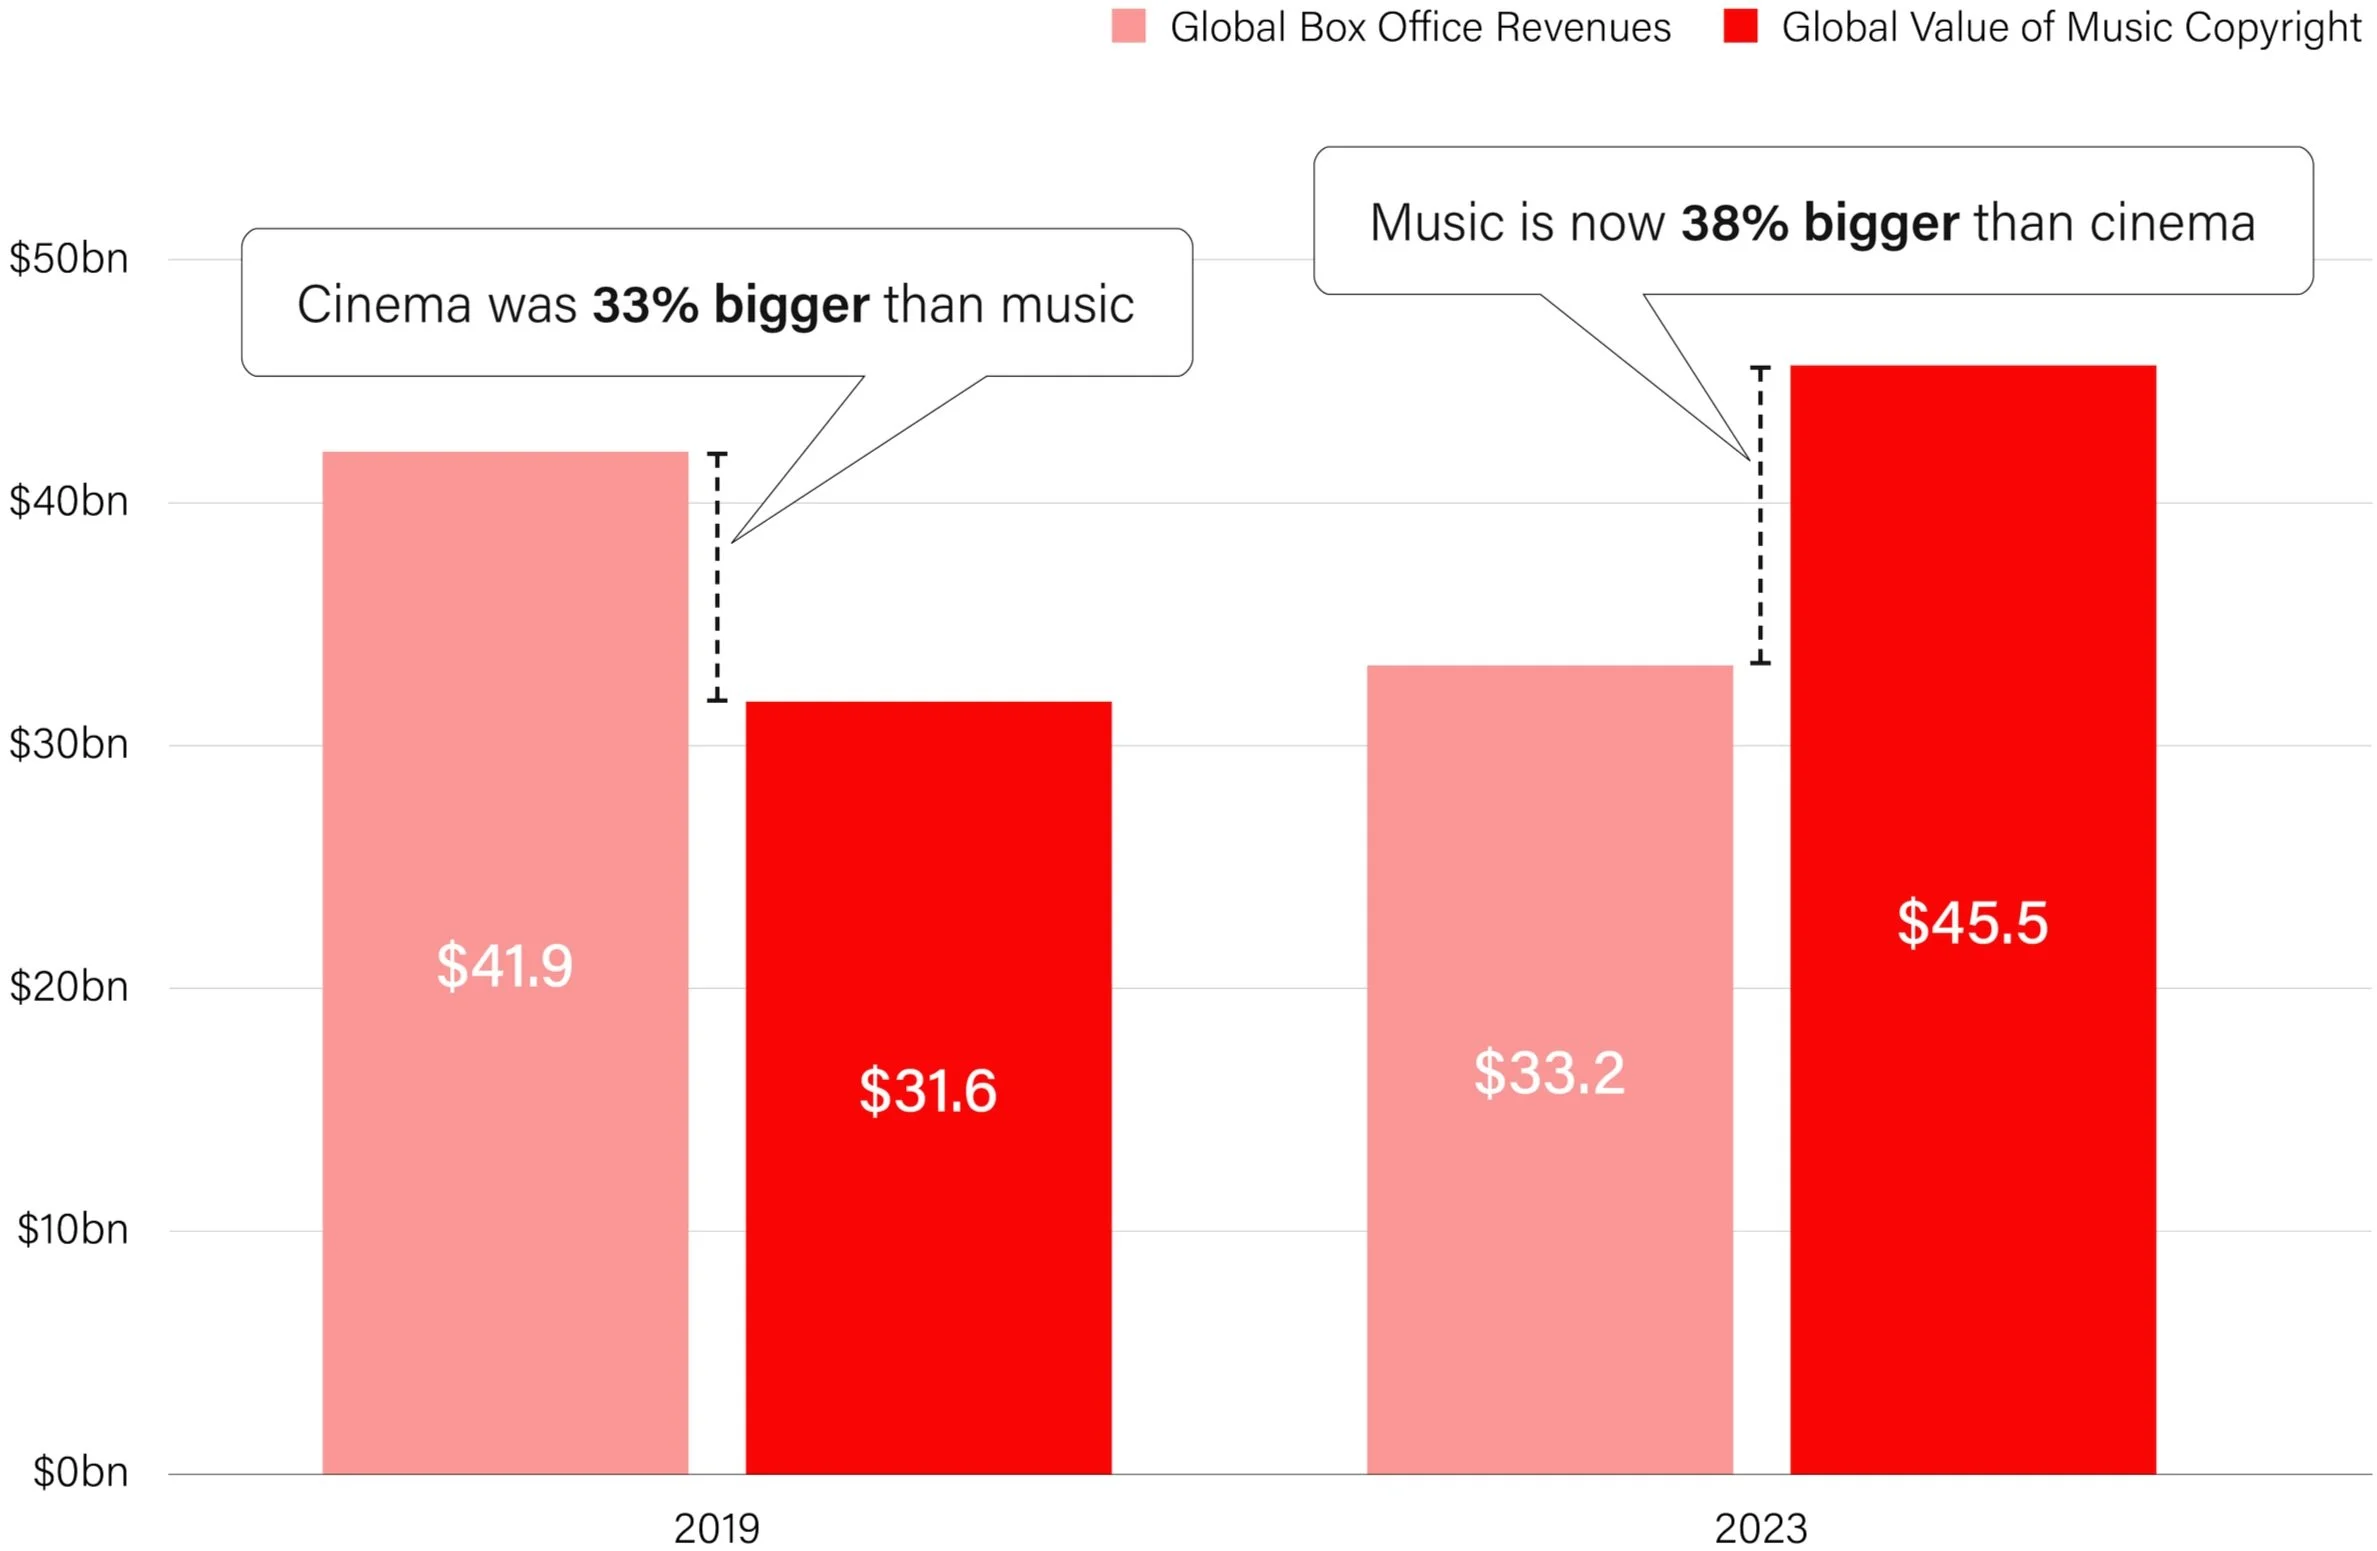
Source: IFPI Global Music Report, CISAC Global Collections Report, Music & Copyright and Will Page
These figures are in fact generous to cinema. Box office is an estimate of gross consumer spending, whereas copyright represents the value to the creator — disregarding the retailer margin and taxes that are included in the box office calculation.
A better comparison is ‘distributor share’ — the revenues that flow back to the distributors of films, a closer estimate to the money returning to movie creators. As Keen explains, “of the $33.2bn in box office spend last year, distribution revenue was only $16.6bn — or half the consumer spend.”[3]
In other words, the value to the creator in music is about treble that in cinema.
2 Estimated by analyst house OMDIA (based on data from the 61 most important markets, including China and India).
3 Based on bottom-up estimates of the relative splits between exhibitors and distributors in the 61 countries.

Image: AdobeStock/StockPhotoPro
Now what, so what?
Cinema’s pain has been the streamers’ gain as we shift attention from the screen to our sofas. Since 2010, streamers have gone from zero to a $100bn‑hero. In pre‑pandemic 2019, the two were neck-and-neck. Then Streaming skyrocketed, while cinema struggled to recover.
A Changing of the (Screen) Guard ($bn)
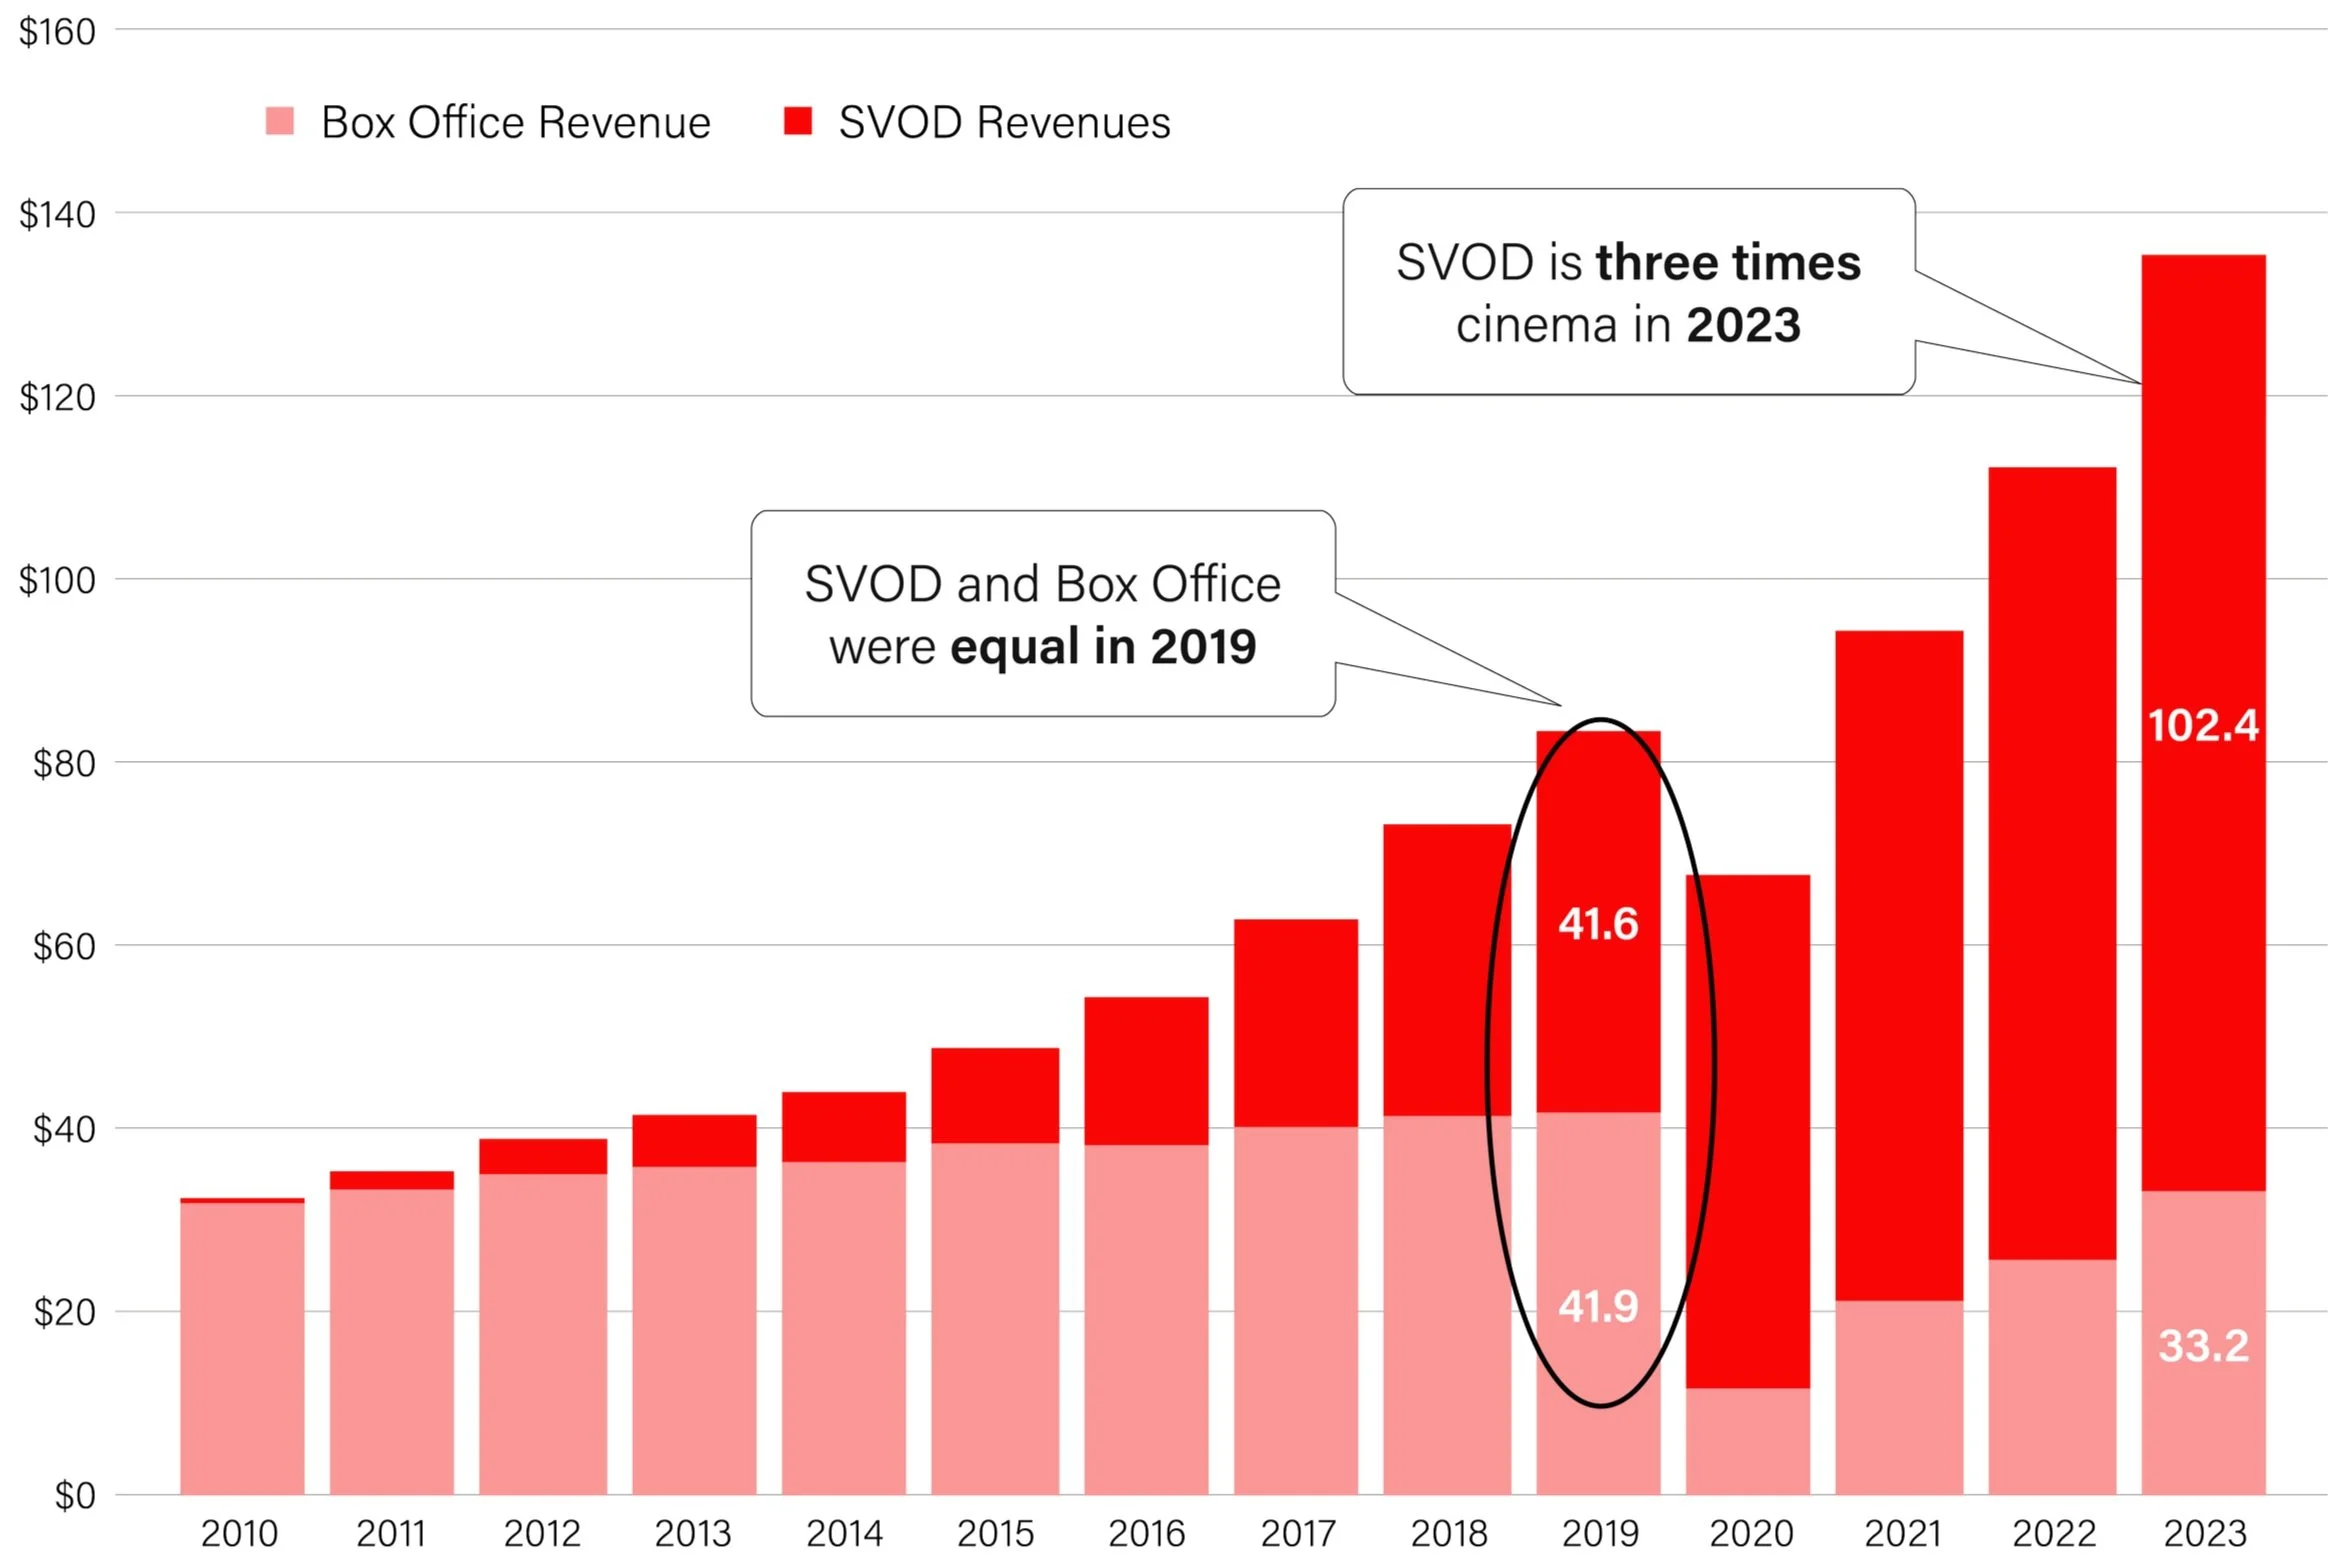
Source: OMDIA, Ben Keen and IFPI Global Music Report, CISAC Global Collections Report, Music & Copyright and Will Page

Image: Adobe Stock/Nopphon
That 65” smart TV in your living room hasn’t just been eating away at the cinema market, though — it’s also been reshaping music. Cinema shares little revenue with music copyright (in the US they share none, although sync revenues are paid upfront). The streamers, on the other hand, must acquire more rights (performing and mechanical plus sync use), face higher tariffs (headline rates are typically double that of cinema) and are now reaching bigger audiences (consumers are investing in their homes more and going out less). This shift in attention, from a couple of hours in front of the silver screen to those same hours on your sofa, has significant ramifications on the value of music copyright, past present and future.
A back-of-the-envelope model hacks together these ramifications by estimating what the cinema industry (both venue and distributor) paid through to songwriters and publishers, and compares that to the streamers. This ‘changing of the guard’ is even more explicit, and advantageous to music, as streamers are now paying five times more than cinema.
Cinema’s Pain is SVODs Gain and Music is Better Off ($bn)

Source: OMDIA, Ben Keen and IFPI Global Music Report, CISAC Global Collections Report, Music & Copyright, Music Publishers and Will Page
A quick reminder that this is just publishing, which collects monies from the video streamers, whereas labels (and their neighbouring rights organisations) currently do not. So labels must surely have some FOMO.
The IFPI reports the entire global sync income (i.e. television, film, advertising etc.) to be only $600m in 2023. If labels could monetise their rights as well as publishers, they would likely experience a similar tailwind from this shift of attention from broadcast to streaming media formats — similar to their success with SoundExchange capturing digital radio.
This shift of attention from linear to non‑linear media formats adds to the Global Value of Copyright.

Image: Unsplash/Rocco Dipoppa
The Glocalisation of Copyright
Time flies. At the start of last year we didn’t know what the tongue-twister term ‘glocalisation’ meant. Now, thanks to a paper co‑authored with Chris Dalla Riva for the London School of Economics European Institute, it's part of the media industry’s global conversation. Glocalisation captures the phenomenon of many local artists topping their local charts on global streaming platforms, and doing so in their mother tongue. Contrary to what theory would have predicted, the world isn’t flat after all.
We’ll close out this year’s report by illustrating how this phenomenon matters to the global value of copyright in terms of trade, exports, and culture.
Global Trade Matters
Economists often argue (and counter-argue, of course) that free trade between countries helps the poor catch up with the rich, because it opens new markets, enables specialisms, and allows countries to become self-sufficient. The jury will be forever out on whether that actually happens. Still, we can use Luminate’s artist-origin classifications to explore what trade looks like for music.
Almost a third of all streams inside America are non-American artists, suggesting glocalisation is happening within the country’s multicultural borders. Unsurprisingly, the ‘British Invasion’ of yesteryear continues to make it the biggest exporter into the US. More surprisingly, is who’s second: Mexico — recently overtaking Canada. Looking further down the list of music‑exporting countries getting heard inside the US you’ll see another surprise: Colombia is ranked sixth.
When relatively poor countries like Mexico ($24,900 GDP per head) and Colombia ($21,400) export music to the richer United States ($86,600 GDP per head), we can calculate the trade‑impact of these rich-country royalties flowing back to poorer countries.
If we calculate the value of Mexican and Colombian artist streams exported to the US at the US royalty rate, and then deduct from that the ‘equivalent value’ of those same streams at their (lower) domestic rates, we can capture the ‘export boost’ effect.
Mexican artists captured over $350m worth of streams inside the US — $200m more than what those same streams would have earned back home. More striking is Colombia, whose artists captured almost $100m worth of streams inside the US, over six times more than what those same streams would have been worth back in Colombia. Indeed, this estimated trade‑boost of exporting those streams to the US alone ($78m) is worth more than their entire Colombian recorded music industry ($74m).
Value to Mexicans and Colombians of Exporting to US ($m)
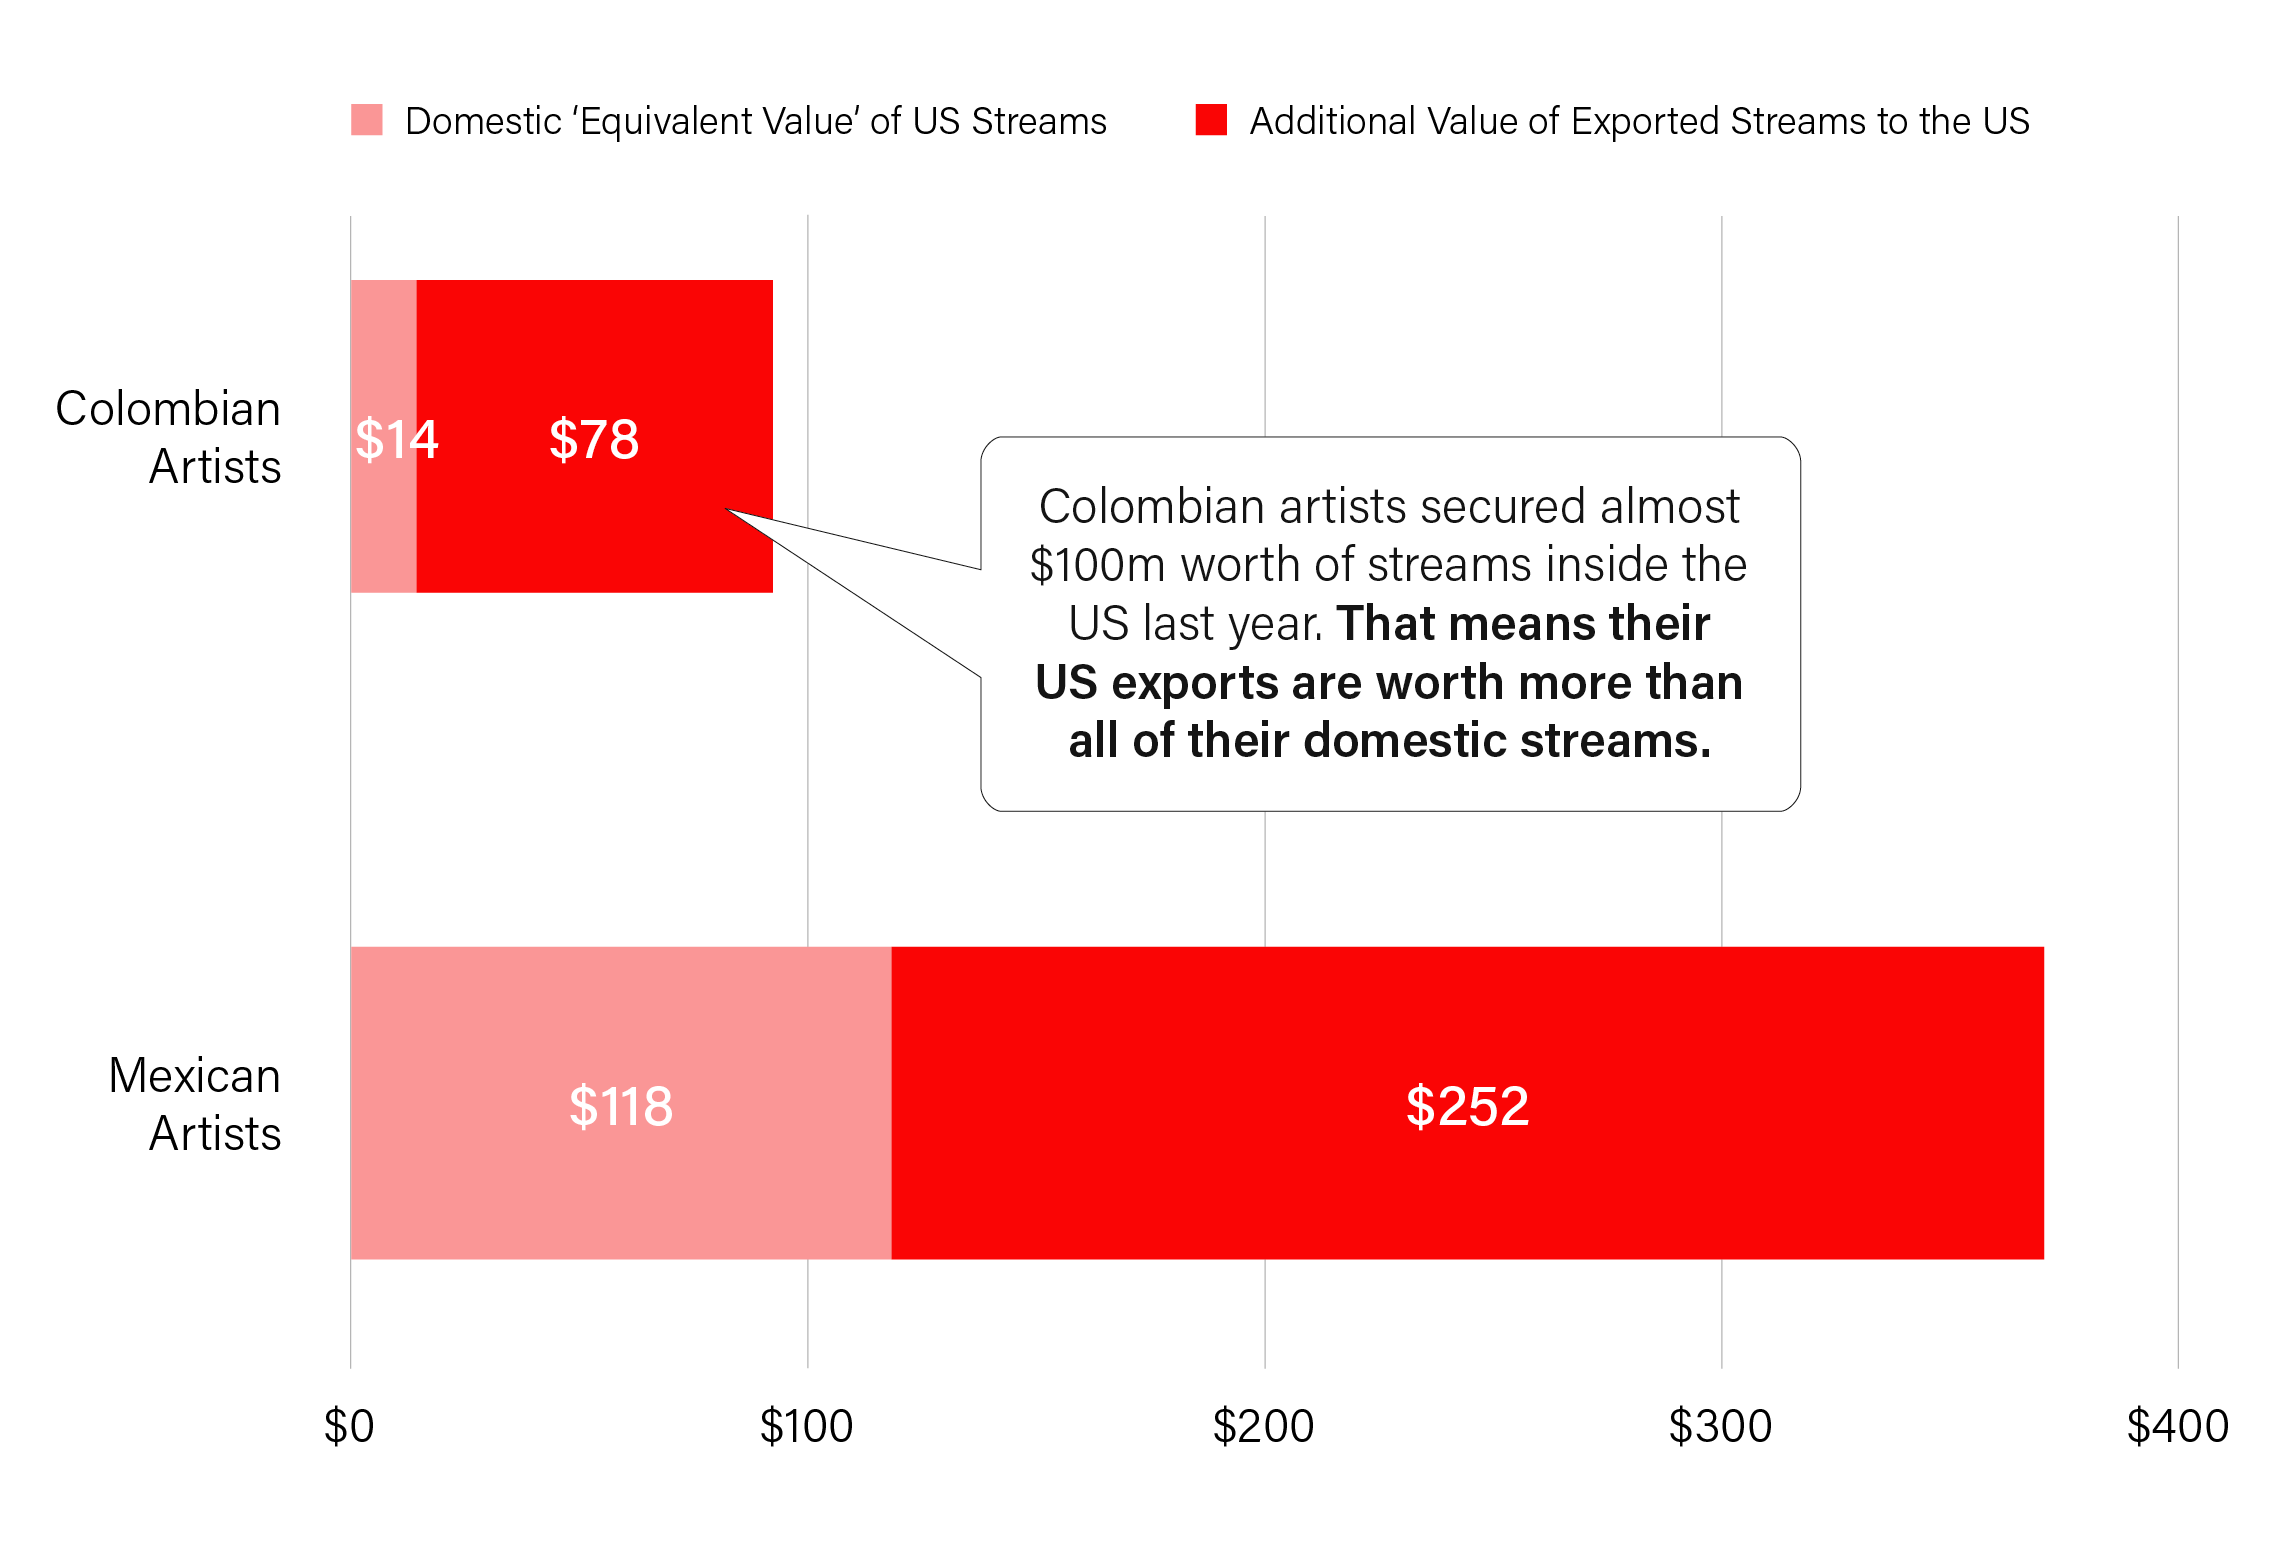
Source: Luminate Audio & Video Streams and authors own calculations
Colombian exports to the US alone ($78m) is worth more than their entire Colombian recorded music industry ($74m).
Music marketers, take note. For labels in Mexico City and Bogotá, there’s a plausible scenario where domestic marketing (at domestic prices) creates export demand (at US prices), resulting in an arbitrage — more bang for their buck (or peso).
From theory to practice, there is one curveball that upsets calculations. For much of South America’s music industry, their unified capital of operations is not in their home markets but rather dangling at the foot of the United States: Miami — a timely reminder of that old joke, “What’s the best thing about Miami? …it’s so close to the United States!”

Image: Adobe Stock/Octavio
Exports Matter
Switching lanes from artists to songwriters, historically, there have been three net‑exporters of music: US, UK, and Sweden. These countries brought in more money in from the exploitation of their songwriters’ rights internationally than they sent out for domestic exploitation of foreign songwriters. Now there’s a fourth: South Korea.
Converting international income and outbound payments into US dollars allows for cross‑country comparisons of a music exports‑to-imports ratio. Across the 227 members of CISAC, only four meet the mark to be called a true net-exporter of music.
Meet the Four Music Exporters

Source: Collective Management Organisations
There are many nuances to this calculation (e.g. relative size of CMO, complex reciprocal agreements, and hit songwriters ‘switching sides’) but this is illuminating for at least two reasons. Firstly, signs point to a drying up of trade (or flows of payments between CMOs). The ratio reported for Sweden back in 2019 was 2.7; now it’s down to 1.8. Ditto the UK, from 2.2 to 1.6. Glocalisation is one factor — as local music dominates local markets, there’s less demand (or trade) for music from beyond the border.
Secondly, it is not always Korean songwriters (or KOMCA members) behind K-Pop hits. Songwriters around the world have gotten in on the action. Obviously, those canny Swedish songwriters are in on the game, often travelling to Korea to work directly with K-Pop artists. Less obvious are Bulgarian artists like Dara, whose song Mr. Rover has been performed by Korean artist Kai — the recording rights stay in Seoul but the songwriter royalties return to Sofia.

Image: AdobeStock/charnsitr
YouTube Matters
Another way to think about music exports is to look at the geographic trends of channel-subscribers on YouTube. Think about it this way: is the rest of the world peering into your country’s artist base more than your own fans are peering out? To answer this, we sum the number of overseas channel-subscribers of a country's domestic artist base, and deduct the aggregate tally of local subscribers to overseas artists.
This offers a novel export metric. Each of our four monetary exporters has a positive fan-follower export balance as well.
YouTube Subscribers: Outsiders Viewing In, over Insiders Viewing Out

There are plenty of caveats. First, duplicate artist channels have been removed and label channels are not considered (although not a big deal in the West, this is a huge deal in India, where for example T-Series has over 278m channel-subscribers, i.e. more than Spotify has paying!). Second, children's channels are omitted. Third, channel-subscribers are obviously not unique — each fan subscribes to many channels. Nevertheless, like much of Chartmetric’s data, this shows illuminating patterns that you’ve never considered before.
Our fourth net-exporter, South Korea, now has 17 times the number of overseas subscribers peering into its K‑Pop market than Korean subscribers of international artists.
Our fourth net-exporter, South Korea, now has seventeen times the number of overseas subscribers peering into its K-Pop market than Korean subscribers of international artists. Indeed, four Korean artists — BlackPink, BTS, Agust D, and Psy — each have more subscribers on YouTube than their own country has people.
Outliers at either end of the spectrum are also illuminating.
At one end, tiny Puerto Rico has thirty-eight (38!) artists with subscriber-bases that exceed the island’s populace. At the other, the troubled market of Australia has 25% more (forty million) Aussies engaging with overseas artists than the wider world is following their own.

Image: Unsplash/Surinder Pal Singh
Diasporas Matter
According to the Indian Ministry of External Affairs, there are 35.4 million non-resident Indians and People of Indian Origins residing outside India. That’s not far off the population of Canada, where at least 2 million such individuals now reside.
You might not be surprised to learn that English and Spanish are the first and second-most streamed languages in Canada. Perhaps more surprisingly, this is followed by Punjabi in third place, while French (one of Canada’s official languages), falls into fourth.
Ranking the top ten artists in Canada who perform in Punjabi throws the spotlight on three ‘Punjabi Canadian’ names and shows how nuanced the concept of ‘country of origin’ has become: Karan Aujla, who tops the list, is a permanent resident in Canada, so qualifies as a Canadian under local rules; Shubh, in fifth, identifies as Canadian but considers India home; and AP Dhillon, in the seventh slot, is usually referred to as a Punjabi-Canadian artist.

Source: Luminate
As these artists climb their homeland charts, Canada is recognising their contribution, with the Juno Awards adding a South Asian category this year. But there’s an even more interesting feedback effect happening overseas, as these stars are reaching even bigger heights in India with the backing of a distinct Canadian-Indian industry. Shubh, for example, ranked 196th in Canada, but 53rd in India — whose population is 33 times larger.
What’s more, this is just audio streams, ignoring the (Indian?) elephant in the room that is YouTube, where eight of the top ten global artists today are of Indian origin. Some rough maths suggest some of these Punjabi-Canadian artists are making (lots) more on YouTube from India than they are back in Canada — a reversal of trade-flows when compared to Colombia. It’s also a stark reminder of the value immigration can bring to a society.
Perhaps we are witnessing a triangulation of glocalisation: (i) the genre of rap is American, (ii) the artist’s country of origin is Canadian, and (iii) and the song’s language is Punjabi. What’s more, two of these artists — Karan Aujla and AP Dhillon — are now seeing their music being lip synced in big Bollywood movies. Such is YouTube's size in India, with almost half a billion users and no competition from TikTok for over four years, that Bollywood is reportedly considering making films directly for YouTube. When that happens, the game changes — again!

Image: Unsplash/Rahul Kukreja
Should our global figure be even bigger?
In this year’s total of $45.5bn, we now have a figure that’s closer to fifty than forty. That’s nuts. It’s also a prudent figure that likely underestimates copyright's true value.
MIDiA, a respected consultancy, estimates global recorded music revenue in 2023 to be $30.5 billion, 6.6% higher than the IFPI. Similarly, for publishing they put the figure around $10bn, a billion more than Music & Copyright. Why the discrepancy? And which should we trust? In a thoughtful piece, Glenn Peoples argues that “neither global revenue figure is right or wrong; they’re just different” and points to MIDiA’s inclusion of the DIY sector and production music.
These discrepancies do, however, leave one sore point lingering above all this work: Global needs to mean global. The United Nations recognises 193 counties, whereas the IFPI yearbook reports on just 56. Worse, MENA (Middle East and North Africa) get grouped together, despite distinct market characteristics. Similarly, CISAC’s Global Collections Report isn’t global either. Shain Shapiro, of the Center for Music Ecosystems, calculates that over forty countries don't even have their own CMO.
If the industry can up its measurement-game, there’s a double‑tailwind that’ll drive the global value of copyright even higher. First, (re)emerging markets will catch up with rich ones and second, as they do, they’ll get more measurement-attention. More value, and more of it being tracked.
Buckle up. This business is changing as fast as it is growing.
Acknowledgements
A huge debt of thanks to Chris Carey (FFWD) for cranking out the global value of copyright. In addition, thanks to Gadi Oron, Adrian Strain, and Sylvain Piat (CISAC); John Blewett and Lauri Rechhardt (IFPI); Jackie Alway and John Phelan (ICMP); Justin Uehlein (NMPA); Simon Dyson and David Hancock (Omdia); Jaime Marconette, Scott Ryan, and Helena Kosinski and Mary Nwangwu (Luminate); Chaz Jenkins and Shashank Chaudhary (Chartmetric); Mark Mulligan (MIDiA); Claire Gillis (Music Canada); Ger Hatton (Independent Music Publishers International Forum); Ralph Simon (Mobilium); Corbyn Ashbury (YouTube); Tom Frederikse (Clintons); Shannon Nitroy (Spotify); Bill Gorjance (peermusic); Fred Goldring (Pressing Business); Chris Dalla Riva (Audiomack); Shain Shapiro (Center for Music Ecosystems); Steve Redmond (Entertainment Retailers Association); and many music industry executives from streaming services, labels, publishers, and CMOs who made this possible. Special thanks to the incredible wordsmith Sam Blake for copyediting and making this calculation comprehensible and Alice Clarke for design and infographics.